Some quick thoughts on Facebook’s Valuation

There is a lot of buzz on the Goldman Sachs investment in Facebook.  If you haven’t heard, Goldman is buying $1.5 Billion worth of facebook common stock at a $50 Billion valuation to give to their clients.  The gist is that they’ll be selling this stock to some of their choice clients in anticipation of a Facebook IPO.

I was watching MSNBC, or one of those business news channels (something I never do) on my plane ride down to the Caribbean last week and the talking head mentioned how Goldman is essentially betting that Facebook can charge a subscription fee for their service and generate large revenues that way.  When I heard this statement, I realized how misunderstood tech “startups” truly are when it comes to mainstream investors.

Facebook is a powerful platform that will drive more and more revenues from advertising, virtual goods, eCommerce, and potentially other revenue streams (more niche social applications like dating, more robust gaming capabilities, etc).  But, I don’t think they will ever charge subscriptions – the value is in the information they can glean which comes from large numbers of engaged users which in part comes from the fact that facebook is free.  I don’t even think debunking this theory deserves more thought than that.

So, what about $50 Billion, is that crazy?  Well, there are lots of rumors about what Facebook’s current revenues and cash flows look like.  I’ve heard that a lot of the reported numbers are inaccurate, so I’m going to refrain from looking at a multiple of revenue or cash flow since we don’t really know what the numbers are, and I don’t think that’s the right way to look at things.  Plus, what could possibly be a comp for facebook?! (as an aside, the best comps would probably be “game changing” companies that got to scale – Netscape, eBay, Google, etc).

One way to think about its value is to understand what the future gross profit Facebook can generate from each user is, apply a discount rate, and get to an enterprise value.  Here we are thinking about value in essentially the same way as a discounted cash flow valuation (which I usually think is pretty weak, but works in this case).  Think about it this way – a typical brick and mortar retailer will value a customer’s email address at $8-$13 (let’s say $10).  That’s because they think they can sell you enough goods where they will get that money back in gross profit over your lifetime as a customer.  So Borders spends $$ to get your email by incentivizing sales people to get you to sign up for loyalty programs, or offering you discounts, so that they can get your info and market to you.  Assume they think you’ll buy $25 worth of books for the next 3 years, at a 20% gross margin, that’s $5 per year in gross profit, and at a 15% discount rate, that’s around $11 in expected value (which is greater than the $10 they spent to get your email in the first place).  Checkout the excel here.

Now, let’s apply the same logic to Facebook.  You’ll notice that I’ve put a 10 year horizon on the life of a Facebook user, and increased the discount rate to 25%, while also increasing the gross margin to 70%.  Hopefully that seems intuitive.

In order for Facebook to be worth $50 B, they would have to think that each of their users is worth (approximately) $50 B/ 500 mm users = $100 / user.  That means that the expected discounted gross profit from each customer has to be about 10x what a brick and mortar retailer would value an email address.  Again, checkout the excel here. And, if you believe that Facebook’s information is different from an email address in that it is about 100x deeper, and they can reach you much more effectively and frequently, then this makes sense.

What also makes sense is that Goldman Sachs is doing something smart with this $1.5 Billion offering – as they usually do with large sums of money.  They may be simply angling to take Facebook public and willing to invest at a high valuation for that reason.  But, they are probably also giving their best clients a chance to participate in what can potentially be one of the most successful IPOs of all time at a private company price.  And, with Groupon looking at a $15 Billion public valuation (per Goldman), it seems they have a close touch on the market for late stage tech deals.  And, the demand that exists is apparently overwhelming.

The bottom line is that Facebook is one of the few companies that represents a true platform capable of tackling many other businesses.  They certainly have the talent and infrastructure, but they also have the information and mind share in their users’ lives.  Think about what companies like Travel Zoo and Open Table (links are to “interesting” stock graphs) have been able to do recently due to adapting Groupon-like deals.  Think about the success that Yelp (article on adoption of their mobile checkin app) had launching their location based app.  These are “platform” companies capable of launching new and profitable business lines.  But, they pale in comparison to Facebook.  Think about Zynga building a multi billion dollar business mostly through Facebook.  This is the power of facebook and why it deserves that $50 Billion valuation, and why it will probably continue to increase in value.

A New Year – And there’s still snow on the ground

As a native New Englander, I enjoy a good snow storm.  It reminds me of building snow forts, skiing, snowmen, and trudging through snow into gyms packed with wrestling mats.  In fact, during our first major storm of the season, right after Christmas, you could find me wandering around SoHo in what others would call a blizzard, taking pictures of the largest drifts and plows moving all that wonderful white stuff around.

Surprisingly, New Yorkers were a bit nicer in the snow.  I saw 3 NYU students push a random car out of a snow bank.  A stranger said hello to me as I treked on through vacant streets that had been completely transformed by the storm.  And, it seemed that inside each window I passed, I saw people inside laughing and enjoying a Sunday evening.  Apparently going out for dinner/drinks during a blizzard is very chic these days.

Of course, there were still misfits in Washington Square Park – I saw two women playing in the snow wearing bikinis in the freezing weather.  And, the grinches of the world were grumbling as plows pushed snow onto the sidewalks and made them virtually impassable.  But, despite all this going on, there was a peaceful air as I walked through the streets that night almost a month and 3 snow storms ago.

I escaped to Aruba for the past 10 days with my family and am now back for another fun year in New York.  There is still snow on the ground, but I’m excited about what the next 12 months has to offer and where the “last year” the Mayan calendar will leave us :)….Happy belated New Year.

Some pictures of NYC from the first storm (clicking on them will actually give a much more viewable version):

Partial Liquidity in Response to Changes in the Capital Gains Tax Code

Many of the larger companies that I speak to are contemplating partial liquidity in 2010 before any potential changes to the capital gains tax code take effect.

The WSJ did a small article on this in last week’s Weekend Edition and I thought I’d run some numbers to see what makes sense when contemplating this decision (dividend taxes could more than double and it looks like long term capital gains will increase 33%).

The attached excel model (see the link below) should provide a working tool to customize this analysis to your own company.  Basically the decision comes down to taking money that is guaranteed and guaranteed to be taxed at a lower rate OR, letting it ride, continuing to grow the business, and keeping a greater equity stake for a larger liquidity event (M&A or IPO) down the line.

Obviously, if your business has Twitteresque growth, you should hang onto the equity for dear life!  But, especially given the relative stability of today’s markets and the relatively strong multiples deals are getting done at, it is worth exploring taking some “chips off the table” this Fall while still keeping a sizeable equity stake in your business to participate in the upside of an IPO or M&A exit.

Another scenario we’ve run into is non-operating partners who have large equity stakes and who may want to take money off the table now.  Especially in the case where these types of companies do not have a strong venture partner, it can make sense to allow those people to cash out, at least partially, in order to bring in a financial partner to help continue the growth of the business.

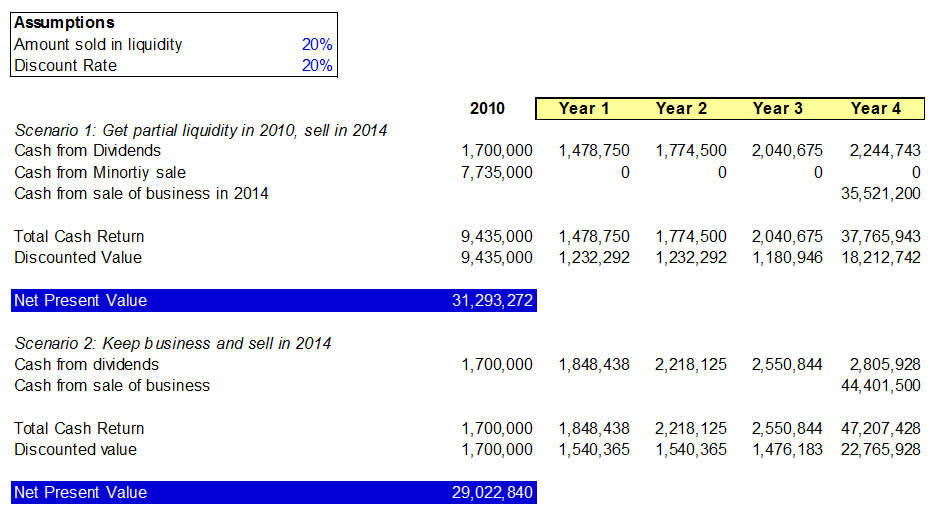
Below is the output of an NPV analysis on a very profitable and quickly growing business.  As you can see, taking some money off the table now makes sense given the assumptions of the model.  I highly suggest downloading and playing with the excel (see link below) to customize it to your business.

Some notes: I’ve basically assumed in scenario 1 that you sell 20% of your equity, continue to grow the business and then IPO in year 4 (2014).  In scenario 2, you keep all the equity, and IPO in 2014.  The cash flows in each scenario are discounted in order to take into account time value of money and also the probability of the business hitting a rough patch and not being able to deliver on projections.  In the excel, you may also want to take into account that partial liquidity/growth capital now could lead to the acceleration of your business if you find the right venture partner, and thus scenario 1 would become even more compelling.  Enjoy!

Cap Gain Taxes Analysis [Excel]

The Search Fund Model

Search Funds are a misunderstood, and little known asset class that gives young, entrepreneurial, and hungry people the ability to accelerate their careers, ditch working for large corporations, and potentially shape an industry.  I have some experience helping out one of these such investment vehicles, and thought it would be interesting to the masses to shed some light on this relatively unknown asset class.

Definition of a Search Fund

The clinical definition of a search fund is a small group of individuals who have secured a pool of capital in order to buy a company, and then become the senior management team of that company.  For example, two guys out of Harvard Business School decide to forgo their offers at McKinsey, raise $10 million, and go find a services business in New Jersey that they acquire, and then run.  This is the 10 second spiel on search funds, but there is so much more to it than that.

Essence of a Search Fund

To understand a search fund, it’s important to understand the type of people who get caught up in this type of venture.  The typical searcher, if there is one, has a few years of investing experience (PE/VC), and most likely some sort of operational experience either as a consultant or as an actual manager in a corporation.  They probably went to either Harvard of Stanford to get their MBA, and have made the decision to go out on their own instead of joining most of their classmates at Goldman/McKinsey/etc.

They have found a group of investors, typically 10-30 high net worth individuals who were former entrepreneurs, private equity investors, or searchers themselves, to give them a commitment.  The investors commit to investing in a deal, if they like it, and also provide some operating capital for office space, internet, etc while the two entrepreneurs search for a suitable target.

Searchers usually work in groups of 2 as the job takes a lot of resilience and discipline – and going it alone can be, well, lonely.  Between the two searchers, you’re looking at a few hundred thousand dollars in forfeited yearly income while they try to find a company that they could grow into an enterprise that would return considerably more than that.

In exchange for giving up the relatively cushy life at a larger firm, the searchers typically rent out a small room in a shared workspace in New York, Boston, or San Francisco.

Most of the time their day to day consists of hustling to find interesting investment opportunities.  They cold call family businesses in Iowa, talk to business brokers, and try to find industry experts through LinkedIn that will give them free advice on tackling a “niche.”

The Niche Philosophy

Searches are industry driven.  The goal is to find a nascent, but growing industry “niche” that is also target rich.  If your radiologist tells you that he just started outsourcing his billing to a company with a call center in Florida, you might want to look into outsourced billing for radiologists.  Say the industry is growing at 30% and is populated by unprofessionalized, small and sleepy companies.  Well, you just found a great niche.

In practice, searchers go through niches quite quickly.  Time is their most scarce resource and so if something isn’t growing fast, is dominated by a large player, or there just don’t seem to be any companies looking to sell, it’s killed.  Sometimes niches are killed after a few days, sometimes after a few weeks.  The typical searcher is looking at ~3 niches at any given time, while also evaluating more opportunistic targets as they come in through brokers, lawyers, and other networks.

Why Give Up My Job At McKinsey?

Earlier in the post I mentioned that searchers give up a lot of income they could have gotten at another job.  Why would any rational human do such a thing?

For starters, most searchers are entrepreneurial at heart and like working for themselves, so that comes at a premium.  Another key component is that searchers get a decent equity stake in the business that they buy, with their investor base getting the rest (unless current owners are rolling equity, but that is a more advanced topic and a discussion for another day).  The portion of the equity can also be stepped up considerably if IRR targets are hit – these targets are typically around 30%.

Acquisition Profile

Searchers look for many things traditional investors look for in a company: recurring revenue streams, high margins, large markets, etc.  But, there are a few things that are MOST relevant.

  • Growth: Searchers get paid on the growth of the company they buy.  Industry tailwinds are a huge plus.
  • A platform: Search fund investors don’t want their searchers to start companies.  They want them to find “platforms” – defined as firms with all of the infrastructure necessary to scale a business – and then grow said platform.
  • Services/Operationally focused businesses: Most searchers do not have any sort of technology/biotech/other special skill set.  Searchers are hard core operations guys who think about efficiency/hiring/sales/marketing/IT all day long and who can take a family owned, unprofessionalized business, and squeeze out margins while growing the company like crazy.
  • Buying right: Searchers need to find a company they can buy at a rational multiple, and maybe even with the help of some debt and/or seller financing (again, a topic for another day).  They are putting all of their eggs in one investment, and need to make sure they are protected!
  • Management: This is the most important and most misunderstood of the criteria.  Searchers are going to become the CEO/COO/CFO/Whatever and so the current owner either needs to be a manager looking to step down and work on a specific part of the business (sales and marketing, research, etc), or retire/move on altogether.  Of course, finding a high growth company where management wants to walk away at a conservative price is a huge challenge!

The Outcomes

Several very successful companies have sprung out of searchers.  Service Source, Asurion, and other, lesser known companies were all searches to begin with.  Of course, there are also many search funds that don’t make it due to the challenges of finding the right company, at the right price, at the right time.

Please be on the lookout for a follow up post with some of the more advanced and specific details around search funds!  Also, below there is a link to a nice research paper on search funds written by folks at Stanford University.  Enjoy!

Search Funds-2009 Selected Observations FINAL – revised 7.21.10(2)

Moving Day! With a little help from NY Startups (And Friends)

So – this weekend I’ll be leaving wonderful 8th ave and heading down to Greenwich village and my old stomping grounds (NYU area).  It’s pretty exciting to be back in what is probably my favorite neighborhood in NYC, and I’ll also be just around the block from my gym – so maybe I’ll have a shot of getting back into shape for Labor Day.

I thought it worth mentioning a few of the different startups that can help make the moving process a bit less daunting.  First off, Skill Slate is an amazing company that allows local service providers (from handymen to DJs) to bid for your business.  Have an AC unit that you really don’t want to install?  Give these guys a shout.  Plus, the company is actually run by a few of my friends here in New York.  Bartek and Brian have done a great job in launching this company and are saving lots of people time and money!!  Check them out.

Skill Slate typically offers skilled laborers to fix your plumbing, or help you pass a spainish test (I like to think of it like Craigs List on steroids with a MUCH better user interface and the ability to look at ratings/reviews for service providers as opposed to emailing random people who may not even exist through CL).  If you are feeling lazy during that long and hot move-in day, Zip Gigs offers more of a grunt labor force to help you run any random errands you forgot to do last minute.  According to their website, they will even stand in line at Shake Shack for you – now that’s helpful!

There are also two startups I know less about that could be a big help in your move.  Prior to leaving, you can list your apartment on Jump Post, and, if it’s successfully rented, there is a nice commission to whet your beak.  Plus, you get to circumvent the masses of incompetent real estate brokers that make their home in New York.  Also, one company still in stealth (and I guess not really NYC based) promises to help you transfer your cable, electric, etc. in one easy portal so that you don’t spend Sunday afternoon waiting in line at the Time Warner store.  Pretty sweet – hopefully I can leverage some of this tech to make this weekend a bit more bearable.

Of course, the most interesting startup in this space is a newco led by Dom Strazzulla and Sahil Amin who are revolutionizing the way that I move.  Though the margins are low, business model unscalable, and work thankless, they still lugged all of my stuff up to my apartment in great form.  I may be their first and last customer, but I must thank these two entrepreneurs for helping me move 😉  Also thanks to Chris Ofstun, his Dad, and his roommate, and Naveed!

“Plain Vanilla” Angel Structure

It’s the middle of internet week!  I’ve already seen 30+ demos, in addition to Meetup Co-Founder Scott Heiferman smashing an iPad on stage at the tech meetup last night (which was at NYU’ Skirball center).  One theme that has been recurrent is that people are unaware of the structure of angel investments.  So, I thought I’d give a brief overview of one common structure.  Please note there is an excel file you can download at the bottom of the post.  It includes detailed notes and may be helpful to have open as you go through the post.

Many seed stage internet businesses look to angels to help them kickstart their companies through growth capital, as well as expertise.  It seems that many people are confused as to what a typical angel investment might “cost” them in equity.  And, while “a convertible note with a 10% PIK and a 25% discount to the series A” (also known as the “plain vanilla” angel structure) may make sense to some people, I thought I’d break down how to interpret that in case there were any non finance geeks out there who were trying to understand what the terms of an angel investment actually mean.

The Basics

I think it’s easiest to use an example to explain this type of investment.  So, Joe is the founder of Newco which is a website that does some sort of location/game based virtual good (insert other buzz words) service.  Joe needs to raise $500,000 to hire a few developers and a sales person.  Joe finds an angel investor who just happens to have a lot of experience in location/game based virtual good services.  Joe’s investor, let’s call her Ms. Jenna, gives him $500,000 and they use the plain vanilla (read typical) angel structure.

Instead of putting a value on the company now, the investor, will get equity based off of the valuation used in Joe’s Series A round of financing (more on that later).  Presumably, when Joe raises his Series A, he will have a few customers, some revenues, and a much better picture for how his company will actually operate.  His company will therefore be more easily valued.

The PIK

PIK stands for paid in kind.  Ms. Jenna is putting up $500,000, and expects Joe to pay her 10% in interest each year.  But, Joe doesn’t have any cash as he is a pre-revenue startup.  So, instead of paying in cash, Joe is going to take the value of the dollars he would pay Ms. Jenna, and add that to the principal of the investment.

In our example, in the first year, Joe will take the 10% interest payment (worth $500,000 x 10% = $50,000) and add that to the principal of the investment, which will now be $500,000 + $50,000 = $550,000.  In the next year, Joe will be charged 10% on that new principal.  His new interest payment is $550,000 x 10% = $55,000.  And his new principal amount is $550,000 + $55,000 = $605,000.  For those familiar, this is the same concept as a negatively amortizing loan.  Instead of paying interest in cash, it is paid as principal, which is the same as saying it is paid in kind (PIK).

The Equity Part of the Equation

We are going to pretend that Joe had a rough go of it and doesn’t raise his series A for 5 years.  In year 5, the principal value of Ms. Jenna’s investment is now $805,225 (please see attached excel to see the calculations, rows 19 and 20 – we just added the 10% interest in each of the 5 years).  The series A investor gives Joe $1 million dollars at a $4 million post-money valuation meaning that they will get $1 mm/$4 mm = 25% of Newco’s equity.  For the difference in pre vs post money valuations, please see the attached excel cell C14.

We said that the angel investment would be invested at a 25% discount to the series A.  This means that instead of investing at a $4 million valuation, Ms. Jenna’s dollars get put to work at a $4,000,000 x (1-25%) = $3 million valuation.  And, her $500,000 originally invested has grown to $805,225 due to the interest which has been paid in kind.  So, her ownership in the company will be $805,225/$3,000,000 = 27%.

At the risk of complicating things, it is worth noting that Ms. Jenna’s original angel investment can also come with a valuation cap, meaning that there is a maximum value that her dollars can be put to work at.  In the excel, I have put this at $10,000,000 so it doesn’t come into play.  But, if Joe’s company was worth $20,000,000 in 5 years when he raised his series A, Ms. Jenna’s equity would be calculated using a valuation of $10,000,000, not the typical 25% discount we have used in our example.  You can see how this benefits the angel investor in the case that they company does take off.  Ms. Jenna will invest her money at a $10,000,000 valuation as opposed to a $ 15,000,000 valuation ($20,000,000 x (1-25%) = $15,000,000)  which would give her a larger equity stake in the company.

End Result

Joe has now raised $1.5 million and is hopefully well on his way to a successful career at the helm of Newco.  He has given up 25% to his series A investors, and 27% to his angel investor Ms. Jenna, and so retains 48% for himself and the rest of his team.

The attached excel sheet has all of these calculations and is set up in a way that you can play around with different assumptions.  Please feel free to email me with any questions! phil (at) philstrazzulla (dot) com.  Also, please note that this is meant to be an overview of one type of common angel structure and that there are definitely more out there.   Enjoy!

The Excel: Angel Investing Basics

Assigning Value Through Social Media

Lately it seems there have been several interesting companies which are ascribing quantitative value to people’s online presence.  With data readily callable from a number of different APIs from companies like Twitter and Foursquare, there are now ways of determining how “important” different people are on the net based on their social graphs.  And, if said people make other data available (Google analytics on their blog, for example), then one can get a pretty accurate picture of the amount of influence these people are having on their peers.

In my opinion, the ability to identify influencers within different demographics and then target them for advertising, coupons, and deals will be an ever increasing trend.  For example, I recently saw a presentation by Dennis Crowley of Foursquare (which was at NYU, that’s right) in which he discussed an analytics package he would be giving to local merchants through which they could track the behaviors of their customers that use Foursquare.

Let’s say you run a paintball arena (I’m getting flashbacks to weekends in middle school).  Through Foursquare, you know that your customer Billy is an influencer – meaning that Billy typically brings new people to the arena.  You, as the arena owner, give Billy an upgraded gun and free paintballs each time he comes based on his mayor status/badges/customer loyalty.  This incents Billy to come back more and more, and we know from his past behavior, and maybe even his behaviors at other local merchants, that he tends to bring a pack of people with him – many of which are first time paintballers and wouldn’t have come otherwise.

In this example, the local merchant was able to acquire new customers by targeting Billy and giving him an incentive to come back more often.  This isn’t rocket science.  But, it will be interesting to follow how companies, particularly facebook, utilize this kind of data.  facebook knows who influencers are by whose status is commented on, whose pictures are looked at, who leads a new trend of “liking” something, etc.  Being able to map someone’s social dynamic is very powerful.  Instead of targeting boys who see Ronaldinho wearing Nike, you can now target Johnny’s friends who are jealous of his new Nike shoes because he is the captain of the soccer team and a leader in his social group.  Or, Nike can tailor their advertising to Johnny’s friends’ parents, especially before a birthday is coming up.  This is powerful stuff!

Another example, Sysomos is a company that dissects data on how people use social media.  This data on past behavior is used to assign a value to a user. For example, if someone on Toyota’s site has been to the BMW and Audi facebook pages, then they are most likely looking to make a purchasing decision and therefore are assigned a high value by Sysomos.

Lastly, Shortboard is a company that tries to assign value to someone based on their online presence, and then attach logos to their online avatar.  So, Bob has a fishing blog with 10,000 monthly uniques, a twitter following of 1,000, and so he warrants a certain score, and is offered $500/month to associate Bassmaster’s logo with his online avatar.  Pretty cool.

Your New Investment Portfolio

Not long ago someone asked me what I thought they should do with the money currently in their savings account.  With interest rates near 0%, it’s tough to watch any sizable balance just sit there.  While most of my own investments are in equity ETFs (I was lucky enough to buy a large chunk last year in early March), I think there are some really interesting investing opportunities which are being facilitated by startups.  I’m sure I’ll miss a few categories that should be on the list, so feel free to email me: phil (at) philstrazzulla (dot) com, or leave a follow up in the comment section.

Private Company Stock

Thanks to companies like New York based SecondMarket, individuals now have the ability to buy stock in private companies from facebook to LinkedIn.  Funnily enough, some private investment funds, notably Bono’s Elevation Partners, have used similar channels to make purchases.  SecondMarket continues to grow and they are adding new asset classes to their already diverse platform.  They have also posted some interesting data on who is participating in these markets, and what is being traded the most.

Peer to Peer

Peer to Peer lending allows one to lend small amounts of money to people across the country.  Many of these folks can’t get money through traditional channels such as credit cards and equity loans, so the interest rates are fairly high for what are usually short term loans.  According to Lending Club the average returns on their platform have been about 9.5% – not bad (check out this graph which compares their returns to treasuries and stocks).  It will be even more interesting to see if these companies develop structured products so that investors can take advantage of these yields while diversifying the risk of being burned by a small group of people that don’t end up paying back the loan.  And, it will also be interesting to see how they create transparency in these markets to avoid some of the pitfalls of overly complex and correlated mortgage backed securities.

Micro Lending

Micro lending has been around for a long time now.  Basically, loans of $50-$2,000 are given to folks in third world countries so that they can buy anything from wheelbarrows to a cell phone in order to improve their lives and many times their businesses.  Returns in this market are actually pretty high with repayment rates averaging around 98%.  One company, DVELO, is raising capital mostly from college students and socially responsible young professionals (but I’m sure they’d take your money too).  DVELO raises capital which is then passed through to the actual micro lenders – of which there are about 3,000 globally.  One interesting thing I learned from the founder of DVELO is that many of these companies lend to a group of 3-4 neighbors who share the responsibility of the loan.  This means that if you can’t make up your portion, you have to suffer the financial and social consequences, creating a larger incentive to repay your loan.

A New Spin on Angel Investing

Angels are wealthy individuals who give money to early stage companies who need cash to grow their business.  Many times Angels also provide expertise and their network in order to jump start a business.  There are now companies emerging which plan to offer online market places for raising seed money (and some will also facilitate later round funding).  Microventures has yet to launch formally, but was written up by PeHub last month (the article has since been archived and requires a subscription to view it).  The way that this and similar services would work is businesses would post information about their business, goals, and how much they needed to raise.  There would then be the opportunity for people to submit bids on how much they’d like to invest and under what terms.  There are obviously a lot of issues (not least of which is confidentiality), but it seems like an interesting idea and possibly something to delve into further after this service launches.

There you have it – my advice for where you can invest your capital and try to avoid the risks inherent in the below graph from the WSJ.  Enjoy!

From the Wall Street Journal

The Predictive Power of Early Adopters

I recently read an article on Tech Crunch about Evernote, a startup that “allows users to capture, organize, and find information across multiple platforms. Users can take notes, clip webpages, snap photos using their mobile phones, create to-dos, and record audio.”  Click here to read more (this link takes you to their Crunch Base page.  If you haven’t used Crunch Base before, check it out as it’s a great resource for information on startups, VCs, etc).

The thing that caught my eye about the article was the stats on who is using the product:

A full 79 percent of its daily mobile usage is on the iPhone OS, including the iPhone itself (63 percent), the iPod Touch (7 percent), and the iPad (9 percent). Android makes up 12 percent of daily mobile usage, and Blackberry is only 2 percent. On the desktop, Windows rules with 49 percent of daily desktop usage, followed by the Mac client (38 percent), and the Web (13 percent).

I was particularly interested in the Mac/Windows comparison as I think there is less noise there.  About 8% of people browsing the web globally use Macs.  But 38 % of this product’s usage on the desktop is through a Mac.  To me, measuring the user base of new and rapidly growing products like Evernote is an interesting way of spotting trends in other markets.  If you believe that early adopters are also influencers, then you can see how user data on companies like Evernote are quite relevant to the broader technology marketplace. Here, the implication of the leading trend is that more and more people will buy Macs in the future.  There is a higher percentage of Evernote users coming from the Mac relative to the market as a whole.  If these users are influencers, then their behavior predicts an uptick in the overall market share of Mac.  Similarly, it appears that blackberry’s 2% share implies they are on a downward trend versus the iPhone and Android operating systems.

Thinking in this vain reminded me of another company called Recorded Future.  Recorded Future basically takes events happening now to try and predict the likelihood of future events.  Sound familiar?  This is basically what any type of predictive modeling does.  But, they seem to go about it in a different way.

Recorded Future is, according the WSJ, the only Google Ventures portfolio company not publicly announced as such.  The business generates what it calls momentum curves which predict the likelihood of an event happening.  For example, the momentum curve (which is computed through a computer algorithm) of a HP/Palm merger would rise if management from both companies were known to have visited Aspen within the same week.  This would imply that there was some sort of meeting to discuss plans on structuring a deal and integrating their businesses.  I’m not sure of the validity of this type of rational (or where they’d get this sort of data) – but it is a very interesting concept!

Similarly, trends in certain emerging technologies are probably predictive of trends in other, tangential markets.  But, it would seem that picking which markets are strong predictors is challenging.  For example, the Mac/Windows split of the Microsoft Office suite may not be all that telling. For starters, the penetration of this product amongst all computer users is fairly high, and so it will be more or less reflective of the overall current Mac/Windows market share (as opposed to being reflective of early adopters which we are assuming are predictive of trends). We can also note that applications like Evernote are for consumers, not businesses.  And so, while Macs may be picking up speed in demographics like college students, the popularity of Evernote doesn’t mean that in 5 years investment banking analysts will be using Numbers on their Macs instead of Excel on a Windows machine.  There is probably also geographic concentrations of Evernote users meaning that our 8% penetration rate needs to be adjusted.

In order to use this type of analysis, one also has to take a stance on where the web and technology is going.  If Evernote (or a similarly fast growing and viral company – say FourSquare) is a predictor of broader technology markets, that implies that in the long run these types of applications will be common place.  However, I could envision a future where there is a large subset of the population that uses technology for a few basic things (email, word processing, spreadsheets, research) and shuns the future iterations of applications like Twitter, FourSquare, etc.  But, even if this is the case, the early adopters could still be influencers on the broader population, and their purchasing decisions affect even those who shun web X.0.

I’m really curious if there are any readily available past examples of trends in nascent, tangental markets being leading indicators for what happened in related but more mature markets.  I’m sure there are historical examples to prove and disprove this trend theory.  If anyone knows any relevant data points, feel free to send me an email: phil (at) philstrazzulla (dot) com, or post in the comments.

Also, writing this post has inspired me to follow up with a short post on how companies are mining users’ social graphs and activity in social media in a few interesting ways.  Be on the lookout!

10,000 Nights at a Casino – Revisted

I don’t really want to spend anymore time on what I thought was an interesting but somewhat fruitless exercise.  However, there seems to be some misconceptions about my last post on using Python to test a basic roulette strategy.  And, I have gotten some people saying that there is no possible way for the roulette strategy I outlined to have a positive expected outcome.

The arguments I received were mostly “well, if that is true, then why isn’t everyone doing it?”  Personally, I think that is a terrible reason for disqualifying anything.  This mindset reminds me of the efficient market hypothesis (EMH) we were taught in school. This theory basically states that all information regarding a stock is going to be available to the general market and thus priced into the stock.  The overarching theory is that generally there are no opportunities to make “outsized returns” – meaning beyond the average, unless you get lucky.  I think that the capital markets in particular have shown this theory to be outdated and ridiculous.  This is besides all of the interesting businesses/people that have made “outsized returns” even in markets that were mature.  But in this case, EMH may hold true as there is no way to make outsized returns on this game without a bit of luck.  Regardless of the validity of this argument, I personally prefer theses grounded in quantitative analysis where possible – and this is definitely a situation where numbers are applicable and available.

To make one thing clear: my theory, which I likened to picking up nickles in front of a steam roller, isn’t necessarily one that I would employ.  However, I thought it was an interesting thought experiment (and by no means an original idea as Dave pointed out in the comments).  I also thought it was a good basis to explain some interesting concepts and introduce Python.  I’ll focus this post on probability theory, once again using my strategy as an example.

It is impossible to gain an advantage in a game where you are expected to lose on a case by case basis.  Meaning, if you bet $1 on black, you should expect to get back less than $1 on average.  Sometimes you will win and come away with a $1 profit, but more times you will lose and come away with $0.  Specifically, your chances of winning are 47% (18 possible winning outcomes/38 possible outcomes), and your chances of losing are 53% (20 possible loser outcomes/38 possible outcomes).  So, your expected profit (which is defined as the average returns you would expect to get if you did this bet infinity times) would be ($1 * 47%)+(-$1*53%) which is about -$0.05.  This is how casinos make money.  You bet the same amount each time and they win, on average.  In this case, they will, on average, win 5.5 cents on each spin.

So, my strategy is to double your bet when you lose.  But, that means you are just spinning again, with more money on the table, and thus an even greater expected loss.  If you double your bet, your expected loss is now ($2*47%)+(-$2*53%) which is about -$.11 (no surprises that your expected loss doubles each time you double your bet).  So, doubling your bet doesn’t help you in the long run!  But, this doesn’t translate perfectly to the strategy as we will see.

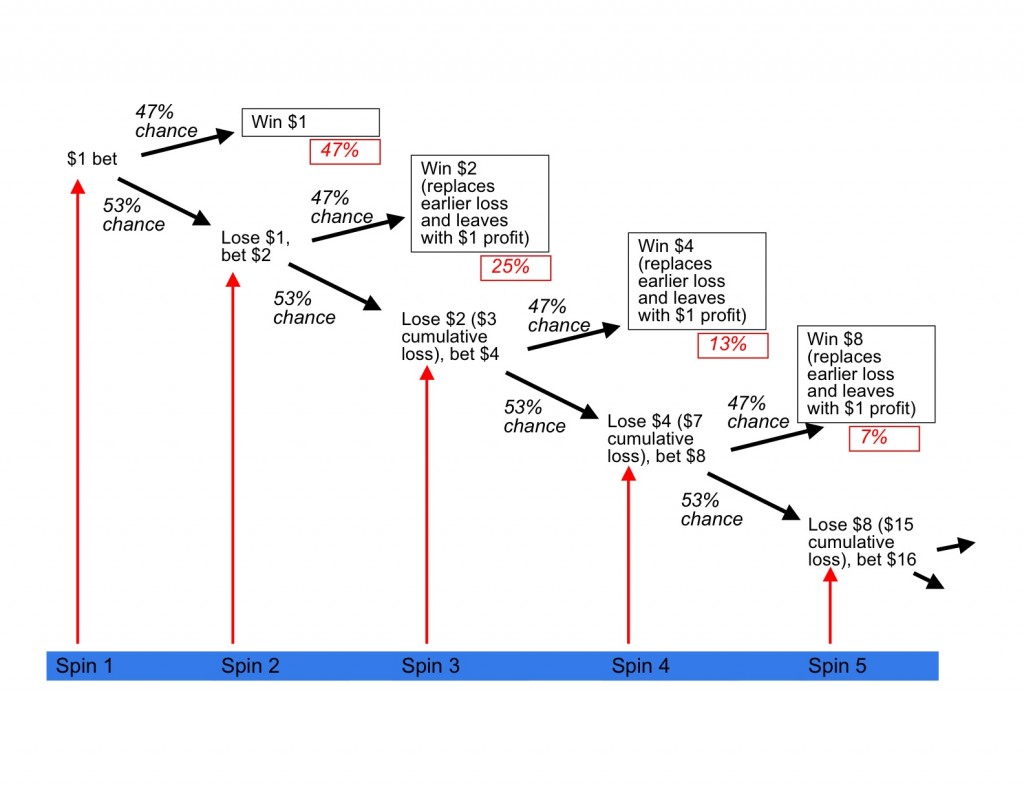
Your probability of winning that second spin and thus recouping your losses is only 47%.  But, you only have to spin this second time if you had lost previously.  So, while the second spin is an independent event (meaning that whether the ball lands on red, black, or 0, 00 the first spin has no bearing on where it lands the second), you are only spinning if you lost the first time.  To illustrate this, see the below tree of potential outcomes.

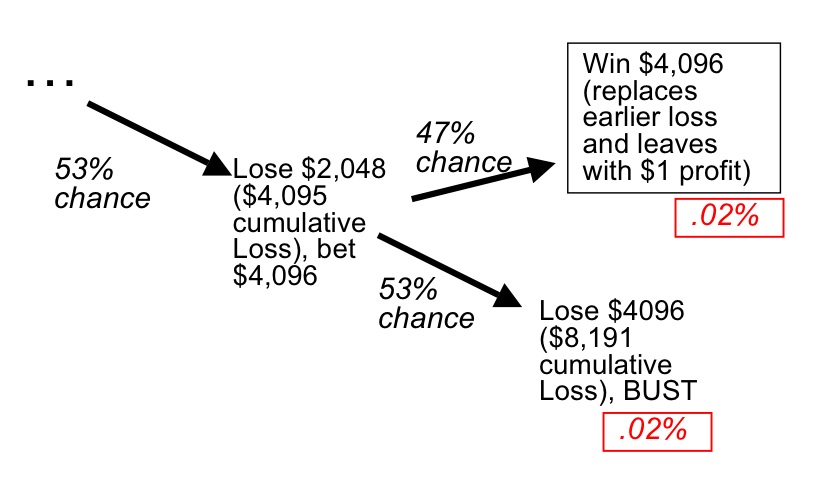
The above tree displays the following series of events: we start with a $1 bet, there is a 47% chance that we win and make a $1 profit.  There is a 53% chance we lose.  If we lose, we double our bet and there is a 47% chance we win and recoup our losses and make a $1 profit.  There is a 53% chance we lose again and then have to double our bet again and so on.  The red boxes are the probability of any given outcome occurring.  All of the outcomes in the black boxes recoup our losses and yield $1 profit.  Below is what the final piece of the decision tree would look like assuming our limiting factor (a table maximum bet) is $5,000:

We can see that the chances of either of the two outcomes in our 13th spin actually happening when we start is very low – only about 2 basis points (a basis point is a percent of a percent, also abbreviated as bps, 100 bps = 1%).  So, we can agree by looking at the outcome tree that all outcomes besides the BUST scenario yields a $1 profit.  Therefore, our expected value calculation is ($1 * the chances of us not going bust) + (-(value of final bet + accumulated losses) * chances of getting to this outcome).  In our scenario, the equation is as follows: ($1 * 99.98%) + (-($4,095+$4,096)*.02%) = -$0.85.  So, each time we put our initial $1 bet on the table, we could expect to lose $0.85.

The previous post concluded that after 10,000 nights in a casino, employing a similar strategy, one could very well walk away a winner.  Of course, here we see that our chances of losing our shirt are .02%, or 1 in 5,000 iterations (where an iteration is each time you start over with a $1 bet).  So, in 10,000 nights, it is very possible for us to get lucky and never hit the BUST scenario where we lose all of our money.  The conclusion is that, if you can find a casino that will allow you to employ this strategy, you may just get lucky in the short term and make some money.  Personally, I’d rather play craps!

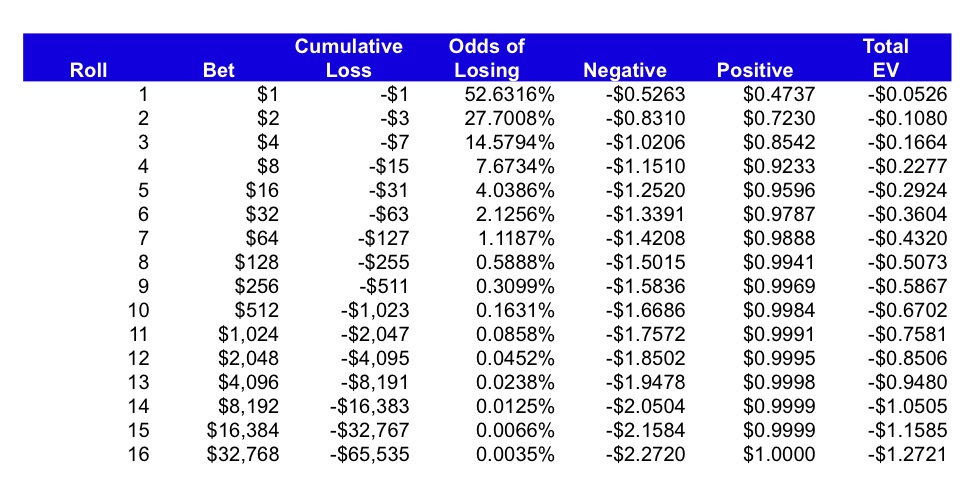
Here is a table which provides some detail on how your expected payoff can change depending on how far you push it.  The ‘Negative’ column = the chances of losing * -(cumulative losses + current bet).  The ‘Positive’ column = the chance you don’t go bust * $1.  The excel is downloadable at the end of the post.

Hopefully this post clears up a few things about the previous one, and also sheds some light on basic probability models and how one would think about proving the validity of this strategy outside of the monte carlo simulator presented in the past post.  I also hope I will write more posts on open bars in the future, as opposed to ones with so many excel/powerpoint graphics!

Roulette pt 2 math